Overview
In June 2026, Mayor Lurie directed a cohort of city departments to come together around a focused effort to improve conditions in the Mission District. In response, departments have aligned operations, increased enforcement, expanded supportive services, and activated public plazas so residents, families, workers, and commuters can once again feel safe and proud of these spaces.
These dashboards highlight our progress on the core priorities: suppressing the sale of stolen goods, reducing open‑air drug activity, improving everyday street conditions, improving transit rider safety and connectivity, and increasing community use of plazas through pro‑social, community‑led activations. Together, these efforts form an integrated strategy to strengthen public safety and restore the Mission’s public spaces as welcoming, vibrant places.
Coordinating departments
- BART
- DEM
- DPH
- SFMTA
- SFSO
- SFPD
- OEWD
- DPW
- SFFD
- Rec & Park
- Mayor's Office
This page tracks progress during the dedicated multi-agency effort and will refresh monthly through the end of 2026. Each objective below tracks its key results (KR) over time, with a dashed line marking when the activation began (June 6, 2026), plus supporting activities, the effort behind those results. Click any metric name for its full monthly history.
Navigation
Objective 1
Suppress Fencing (The Selling of Stolen Goods)
- KR 1.1 · Notices of Violation 191 notices issued (Aug) ↓12%
- KR 1.2 · 1st Citations 37 citations issued (Aug) ↓10%
- KR 1.3 · 2nd Citation 7 citations issued (Aug) ↑17%
- KR 1.4 · Misdemeanors 3 charges filed (Aug) ↑100%
Objective 2
Suppress Open Drug Activity
- KR 2.1 · Drug-activity 911 reports (“suspicious person, drug-noted”) 17 calls (Aug) ↓23%
- KR 2.2 · Dealer arrests (drug distribution) 1 distinct incidents (Aug) ↓75%
Objective 3
Improve Street Conditions
- KR 3.1 · 311 tickets for encampments 17 tickets (Aug) No change
- KR 3.2 · 311 tickets for human/animal waste 59 tickets (Aug) ↓13%
- KR 3.3 · 311 tickets for trash 113 tickets (Aug) ↑4%
- KR 3.4 · Street Conditions Scouting Report 3.83 avg score (1-5) (Aug) ↓4%
- KR 3.5 · 311 Graffiti Reports 53 reports (Aug) ↑20%
- KR 3.6 · 311 Street Cleaning Requests 316 requests (Aug) ↓25%
Objective 4
Improve Rider Safety & Connectivity
- KR 4.1 · Muni ridership recovery percentage by route 112.0 % of pre-pandemic baseline (Jul) ↓1%
- KR 4.2 · Average daily Muni boardings 117,200 boardings (Aug) ↑3%
- KR 4.3 · BART Ridership by station 12,589 avg weekday riders (Jul) ↓5%
Objective 1 Suppress Fencing (The Selling of Stolen Goods) 4 KPIs
Reduce fencing on and immediately around the 16th and 24th Street BART plazas.
The legislation behind this objective
This objective reflects a significant expansion of San Francisco's tools to address illegal sidewalk vending. In 2025, Mayor Daniel Lurie advanced local legislation to strengthen enforcement against unpermitted vending, while State Senator Scott Wiener authored SB 276, the SAFE Streets Act, in partnership with the Mayor. The state law gives San Francisco additional authority to address vendors selling commonly stolen goods without a permit or proof of purchase.
The new local and state authorities took effect in phases between December 2025 and June 2026, creating a stronger enforcement framework that allows the City to move from education and warnings to citations and, where warranted, misdemeanor penalties. The objective's enforcement KRs track the City's implementation of these new authorities and their impact on street conditions.
Key results
Methodology & caveats
Count of Notices of Violation issued to unpermitted vendors at or near the plazas. Tracked as a key result for this objective but not scored up/down: a rise can reflect stepped-up enforcement effort as easily as more violations, so it's read alongside the other three enforcement stages rather than judged alone.
| Month | Jun | Jul | Aug | Sep | Oct | Nov | Dec |
|---|---|---|---|---|---|---|---|
| Notices issued | 230 | 216 | 191 | Pending | Pending | Pending | Pending |
Methodology & caveats
First-citation count in the progressive enforcement sequence for unpermitted vending. Not scored up/down, for the same reflexivity reason as Notices of Violation.
| Month | Jun | Jul | Aug | Sep | Oct | Nov | Dec |
|---|---|---|---|---|---|---|---|
| Citations issued | 9 | 41 | 37 | Pending | Pending | Pending | Pending |
Methodology & caveats
Second-citation count for vendors who continue after a first citation. Not scored up/down, for the same reflexivity reason as Notices of Violation.
| Month | Jun | Jul | Aug | Sep | Oct | Nov | Dec |
|---|---|---|---|---|---|---|---|
| Citations issued | 0 | 6 | 7 | Pending | Pending | Pending | Pending |
KR 1.4 — Misdemeanors
↑100%Methodology & caveats
Misdemeanor charges filed against vendors who continue after the progressive citation stages. Not scored up/down, for the same reflexivity reason as Notices of Violation.
| Month | Jun | Jul | Aug | Sep | Oct | Nov | Dec |
|---|---|---|---|---|---|---|---|
| Charges filed | 0 | 0 | 3 | Pending | Pending | Pending | Pending |
Objective 2 Suppress Open Drug Activity 2 KPIs
Reduce open drug activity on and around the BART plazas.
Key results
Methodology & caveats
Community 911 "suspicious person" calls whose notes mention drug/dealer/sales/meth language, excluding on-view (officer-initiated) stops, within 100 meters of the 16th or 24th Street BART plazas (roughly 15th to 17th St, Capp to Julian). This tracks citizen perception and is robust to changes in enforcement levels, unlike arrest counts. Down = good.
| Month | Feb | Mar | Apr | May | Jun | Jul | Aug | Sep | Oct | Nov | Dec |
|---|---|---|---|---|---|---|---|---|---|---|---|
| Calls | Pending | 19 | 29 | 35 | 28 | 22 | 17 | Pending | Pending | Pending | Pending |
Methodology & caveats
SFPD drug-offense incidents narrowed to distribution/dealing charges (sale, transport, furnish, deliver, manufacture, traffic, cultivate, maintain premise, money offense, drug lab apparatus) with an adult cite-or-arrest resolution, within 100 meters of the 16th or 24th Street BART plazas (roughly 15th to 17th St, Capp to Julian), counted as distinct incidents. Up = good (supply disruption). Caveat: arrest counts are partly reflexive — a rise can reflect enforcement effort, not only more dealers, so read alongside KR 2.1, not alone.
| Month | Feb | Mar | Apr | May | Jun | Jul | Aug | Sep | Oct | Nov | Dec |
|---|---|---|---|---|---|---|---|---|---|---|---|
| Distinct incidents | Pending | 0 | 9 | 2 | 5 | 4 | 1 | Pending | Pending | Pending | Pending |
Objective 3 Improve Street Conditions 6 KPIs
Reduce the everyday street-condition complaints — encampments, human/animal waste, and trash — reported around the plazas.
Key results
KR 3.1 — 311 tickets for encampments
No changeMethodology & caveats
Count of SF311 cases with category "Encampments" (the dataset also has an older "Encampment" label used before a taxonomy update; both are included), within 100 meters of the 16th or 24th Street BART plazas (roughly 15th to 17th St, Capp to Julian). Down = good.
| Month | Feb | Mar | Apr | May | Jun | Jul | Aug | Sep | Oct | Nov | Dec |
|---|---|---|---|---|---|---|---|---|---|---|---|
| Tickets | Pending | 20 | 28 | 36 | 23 | 17 | 17 | Pending | Pending | Pending | Pending |
Methodology & caveats
Count of SF311 "Street and Sidewalk Cleaning" cases with detail "human_waste_or_urine," within 100 meters of the 16th or 24th Street BART plazas (roughly 15th to 17th St, Capp to Julian). Down = good.
| Month | Feb | Mar | Apr | May | Jun | Jul | Aug | Sep | Oct | Nov | Dec |
|---|---|---|---|---|---|---|---|---|---|---|---|
| Tickets | Pending | 34 | 45 | 62 | 58 | 68 | 59 | Pending | Pending | Pending | Pending |
Methodology & caveats
Count of SF311 "Street and Sidewalk Cleaning" cases with detail "other_loose_garbage_debris_yard_waste" or "other_bagged_boxed_contained_garbage" (loose/bagged trash, not bulky items), within 100 meters of the 16th or 24th Street BART plazas (roughly 15th to 17th St, Capp to Julian). Down = good.
| Month | Feb | Mar | Apr | May | Jun | Jul | Aug | Sep | Oct | Nov | Dec |
|---|---|---|---|---|---|---|---|---|---|---|---|
| Tickets | Pending | 88 | 69 | 156 | 91 | 109 | 113 | Pending | Pending | Pending | Pending |
Methodology & caveats
Daily field observations by SFPD patrol officers who rate street conditions at 8 designated locations on a 1-5 scale (1 = poor, 5 = excellent). Observations are collected three times per day: 2:00 AM, 10:00 AM, and 6:00 PM. The table below shows the average score for each location and shift during the reporting period. Higher scores indicate better conditions.
Methodology & caveats
Count of SF311 graffiti reports on public property within BART plaza + 1 block radius of the 16th and 24th Street stations. Down = good.
| Month | Feb | Mar | Apr | May | Jun | Jul | Aug | Sep | Oct | Nov | Dec |
|---|---|---|---|---|---|---|---|---|---|---|---|
| Reports | Pending | 75 | 58 | 67 | 66 | 44 | 53 | Pending | Pending | Pending | Pending |
Methodology & caveats
Total count of all SF311 street cleaning requests (including waste, trash, and other cleaning types) within BART plaza + 1 block radius. This supplements the specific waste (KR 3.2) and trash (KR 3.3) metrics by showing total cleaning workload. Note: not all street cleaning requests are routed to Public Works—some may go to other departments depending on the issue type and location. Down = good.
| Month | Feb | Mar | Apr | May | Jun | Jul | Aug | Sep | Oct | Nov | Dec |
|---|---|---|---|---|---|---|---|---|---|---|---|
| Requests | Pending | 420 | 321 | 569 | 396 | 422 | 316 | Pending | Pending | Pending | Pending |
Objective 4 Improve Rider Safety & Connectivity 3 KPIs
Improve the public's sense of safety and enjoyment on BART plazas and surrounding SFMTA bus stops and transit facilities.
Key results
Methodology & caveats
Data lags by 1–2 months. Percentage of total monthly boardings in a month relative to that same month in 2019: SUM(Monthly Boardings) / SUM(Monthly Boardings in 2019), per route. Based on automatic passenger counter (APC) data; does not include historic streetcar or cable car ridership. Reported results are subject to change as data quality improves or new data becomes available. Reported monthly by SFMTA (contact: Performance@SFMTA.com). The headline figure above is this same formula applied across all 9 named routes combined (SUM of their boardings ÷ SUM of their 2019 baseline boardings) — a corridor-level rollup, not a separate SFMTA-published number. Filterable by route below.
- Route 14
- Route 49
- Route 22
- Route 55
- Route 14R
- Route 27
- Route 67
- Route 12
- Route 36
| Route | Mar | Apr | May | Jun | Jul | Aug | Sep | Oct | Nov | Dec |
|---|---|---|---|---|---|---|---|---|---|---|
| 14 | 84.8 | 80.5 | 81.4 | 83.1 | 86.0 | Pending | Pending | Pending | Pending | Pending |
| 49 | 151.9 | 141.0 | 142.5 | 143.9 | 145.0 | Pending | Pending | Pending | Pending | Pending |
| 22 | 139.3 | 133.4 | 120.8 | 129.7 | 133.0 | Pending | Pending | Pending | Pending | Pending |
| 55 | 75.6 | 71.5 | 72.9 | 88.2 | 82.0 | Pending | Pending | Pending | Pending | Pending |
| 14R | 121.1 | 116.6 | 112.9 | 116.2 | 117.0 | Pending | Pending | Pending | Pending | Pending |
| 27 | 107.3 | 102.1 | 97.1 | 97.4 | 100.0 | Pending | Pending | Pending | Pending | Pending |
| 67 | 66.1 | 59.1 | 63.1 | 65.8 | 59.0 | Pending | Pending | Pending | Pending | Pending |
| 12 | 121.9 | 117.1 | 117.2 | 124.5 | 123.0 | Pending | Pending | Pending | Pending | Pending |
| 36 | 73.9 | 71.8 | 60.6 | 65.6 | 59.0 | Pending | Pending | Pending | Pending | Pending |
| Month | Mar | Apr | May | Jun | Jul | Aug | Sep | Oct | Nov | Dec |
|---|---|---|---|---|---|---|---|---|---|---|
| % of pre-pandemic baseline | 84.8 | 80.5 | 81.4 | 83.1 | 86.0 | Pending | Pending | Pending | Pending | Pending |
| Month | Mar | Apr | May | Jun | Jul | Aug | Sep | Oct | Nov | Dec |
|---|---|---|---|---|---|---|---|---|---|---|
| % of pre-pandemic baseline | 151.9 | 141.0 | 142.5 | 143.9 | 145.0 | Pending | Pending | Pending | Pending | Pending |
| Month | Mar | Apr | May | Jun | Jul | Aug | Sep | Oct | Nov | Dec |
|---|---|---|---|---|---|---|---|---|---|---|
| % of pre-pandemic baseline | 139.3 | 133.4 | 120.8 | 129.7 | 133.0 | Pending | Pending | Pending | Pending | Pending |
| Month | Mar | Apr | May | Jun | Jul | Aug | Sep | Oct | Nov | Dec |
|---|---|---|---|---|---|---|---|---|---|---|
| % of pre-pandemic baseline | 75.6 | 71.5 | 72.9 | 88.2 | 82.0 | Pending | Pending | Pending | Pending | Pending |
| Month | Mar | Apr | May | Jun | Jul | Aug | Sep | Oct | Nov | Dec |
|---|---|---|---|---|---|---|---|---|---|---|
| % of pre-pandemic baseline | 121.1 | 116.6 | 112.9 | 116.2 | 117.0 | Pending | Pending | Pending | Pending | Pending |
| Month | Mar | Apr | May | Jun | Jul | Aug | Sep | Oct | Nov | Dec |
|---|---|---|---|---|---|---|---|---|---|---|
| % of pre-pandemic baseline | 107.3 | 102.1 | 97.1 | 97.4 | 100.0 | Pending | Pending | Pending | Pending | Pending |
| Month | Mar | Apr | May | Jun | Jul | Aug | Sep | Oct | Nov | Dec |
|---|---|---|---|---|---|---|---|---|---|---|
| % of pre-pandemic baseline | 66.1 | 59.1 | 63.1 | 65.8 | 59.0 | Pending | Pending | Pending | Pending | Pending |
| Month | Mar | Apr | May | Jun | Jul | Aug | Sep | Oct | Nov | Dec |
|---|---|---|---|---|---|---|---|---|---|---|
| % of pre-pandemic baseline | 121.9 | 117.1 | 117.2 | 124.5 | 123.0 | Pending | Pending | Pending | Pending | Pending |
| Month | Mar | Apr | May | Jun | Jul | Aug | Sep | Oct | Nov | Dec |
|---|---|---|---|---|---|---|---|---|---|---|
| % of pre-pandemic baseline | 73.9 | 71.8 | 60.6 | 65.6 | 59.0 | Pending | Pending | Pending | Pending | Pending |
Methodology & caveats
Data lags by 1–2 months. Average number of daily boardings for the month: SUM(Monthly Total Boardings) / COUNT(days in the month), per route. SFMTA's source splits this by Weekday/Saturday/Sunday; the export provided only includes Weekday figures for these 9 routes, so that's what's shown here. Based on automatic passenger counter (APC) data; does not include historic streetcar or cable car ridership. Reported results are subject to change as data quality improves or new data becomes available. Reported monthly by SFMTA (contact: performance@sfmta.com). The headline figure above is the sum of all 9 named routes' average daily boardings — a corridor-level rollup, not a separate SFMTA-published number. Filterable by route below.
- Route 14
- Route 49
- Route 22
- Route 55
- Route 14R
- Route 27
- Route 67
- Route 12
- Route 36
| Route | Mar | Apr | May | Jun | Jul | Aug | Sep | Oct | Nov | Dec |
|---|---|---|---|---|---|---|---|---|---|---|
| 14 | 22,100 | 21,700 | 22,400 | 22,200 | 21,800 | 22,000 | Pending | Pending | Pending | Pending |
| 49 | 36,400 | 35,900 | 36,600 | 33,800 | 32,900 | 34,400 | Pending | Pending | Pending | Pending |
| 22 | 21,800 | 21,500 | 22,100 | 21,400 | 20,800 | 21,500 | Pending | Pending | Pending | Pending |
| 55 | 1,800 | 1,800 | 1,800 | 1,800 | 1,800 | 1,800 | Pending | Pending | Pending | Pending |
| 14R | 23,500 | 23,500 | 23,700 | 22,800 | 22,200 | 22,400 | Pending | Pending | Pending | Pending |
| 27 | 6,100 | 5,900 | 5,900 | 5,600 | 5,300 | 5,500 | Pending | Pending | Pending | Pending |
| 67 | 800 | 800 | 900 | 900 | 800 | 900 | Pending | Pending | Pending | Pending |
| 12 | 7,700 | 7,600 | 7,800 | 7,700 | 7,700 | 7,900 | Pending | Pending | Pending | Pending |
| 36 | 800 | 800 | 900 | 800 | 800 | 800 | Pending | Pending | Pending | Pending |
| Month | Mar | Apr | May | Jun | Jul | Aug | Sep | Oct | Nov | Dec |
|---|---|---|---|---|---|---|---|---|---|---|
| Boardings | 22,100 | 21,700 | 22,400 | 22,200 | 21,800 | 22,000 | Pending | Pending | Pending | Pending |
| Month | Mar | Apr | May | Jun | Jul | Aug | Sep | Oct | Nov | Dec |
|---|---|---|---|---|---|---|---|---|---|---|
| Boardings | 36,400 | 35,900 | 36,600 | 33,800 | 32,900 | 34,400 | Pending | Pending | Pending | Pending |
| Month | Mar | Apr | May | Jun | Jul | Aug | Sep | Oct | Nov | Dec |
|---|---|---|---|---|---|---|---|---|---|---|
| Boardings | 21,800 | 21,500 | 22,100 | 21,400 | 20,800 | 21,500 | Pending | Pending | Pending | Pending |
| Month | Mar | Apr | May | Jun | Jul | Aug | Sep | Oct | Nov | Dec |
|---|---|---|---|---|---|---|---|---|---|---|
| Boardings | 1,800 | 1,800 | 1,800 | 1,800 | 1,800 | 1,800 | Pending | Pending | Pending | Pending |
| Month | Mar | Apr | May | Jun | Jul | Aug | Sep | Oct | Nov | Dec |
|---|---|---|---|---|---|---|---|---|---|---|
| Boardings | 23,500 | 23,500 | 23,700 | 22,800 | 22,200 | 22,400 | Pending | Pending | Pending | Pending |
| Month | Mar | Apr | May | Jun | Jul | Aug | Sep | Oct | Nov | Dec |
|---|---|---|---|---|---|---|---|---|---|---|
| Boardings | 6,100 | 5,900 | 5,900 | 5,600 | 5,300 | 5,500 | Pending | Pending | Pending | Pending |
| Month | Mar | Apr | May | Jun | Jul | Aug | Sep | Oct | Nov | Dec |
|---|---|---|---|---|---|---|---|---|---|---|
| Boardings | 800 | 800 | 900 | 900 | 800 | 900 | Pending | Pending | Pending | Pending |
| Month | Mar | Apr | May | Jun | Jul | Aug | Sep | Oct | Nov | Dec |
|---|---|---|---|---|---|---|---|---|---|---|
| Boardings | 7,700 | 7,600 | 7,800 | 7,700 | 7,700 | 7,900 | Pending | Pending | Pending | Pending |
| Month | Mar | Apr | May | Jun | Jul | Aug | Sep | Oct | Nov | Dec |
|---|---|---|---|---|---|---|---|---|---|---|
| Boardings | 800 | 800 | 900 | 800 | 800 | 800 | Pending | Pending | Pending | Pending |
Methodology & caveats
Data lags by 1–2 months. Average weekday entries/exits at the 16th and 24th Street BART stations. The headline figure is the sum of both stations; filterable by station below.
- Route 16th St Mission
- Route 24th St Mission
| Route | Mar | Apr | May | Jun | Jul | Aug | Sep | Oct | Nov | Dec |
|---|---|---|---|---|---|---|---|---|---|---|
| 16th St Mission | 6,466 | 6,316 | 6,473 | 6,852 | 6,439 | Pending | Pending | Pending | Pending | Pending |
| 24th St Mission | 6,287 | 6,318 | 6,350 | 6,423 | 6,150 | Pending | Pending | Pending | Pending | Pending |
| Month | Mar | Apr | May | Jun | Jul | Aug | Sep | Oct | Nov | Dec |
|---|---|---|---|---|---|---|---|---|---|---|
| Avg weekday riders | 6,466 | 6,316 | 6,473 | 6,852 | 6,439 | Pending | Pending | Pending | Pending | Pending |
| Month | Mar | Apr | May | Jun | Jul | Aug | Sep | Oct | Nov | Dec |
|---|---|---|---|---|---|---|---|---|---|---|
| Avg weekday riders | 6,287 | 6,318 | 6,350 | 6,423 | 6,150 | Pending | Pending | Pending | Pending | Pending |
Objective 5 Increase Community Usage of Plazas 1 KPI
Improve the public's experience at the plaza by regularly activating space.
Key results
KR 5.1 — Plaza Activations
No changeMethodology & caveats
Count of community activation events held at the 16th and 24th Street BART plazas. Each plaza counts as one activation. The Sábado Gigante series, produced by Mission Lotería, transforms the plazas into welcoming spaces for small businesses, artists, families, and community organizations. Up = good.
| Month | Feb | Mar | Apr | May | Jun | Jul | Aug | Sep | Oct | Nov | Dec |
|---|---|---|---|---|---|---|---|---|---|---|---|
| Events | Pending | Pending | Pending | Pending | 2 | 2 | 2 | Pending | Pending | Pending | Pending |
Case studies & initiative spotlights
SF Recreation and Parks
Alioto Mini Park
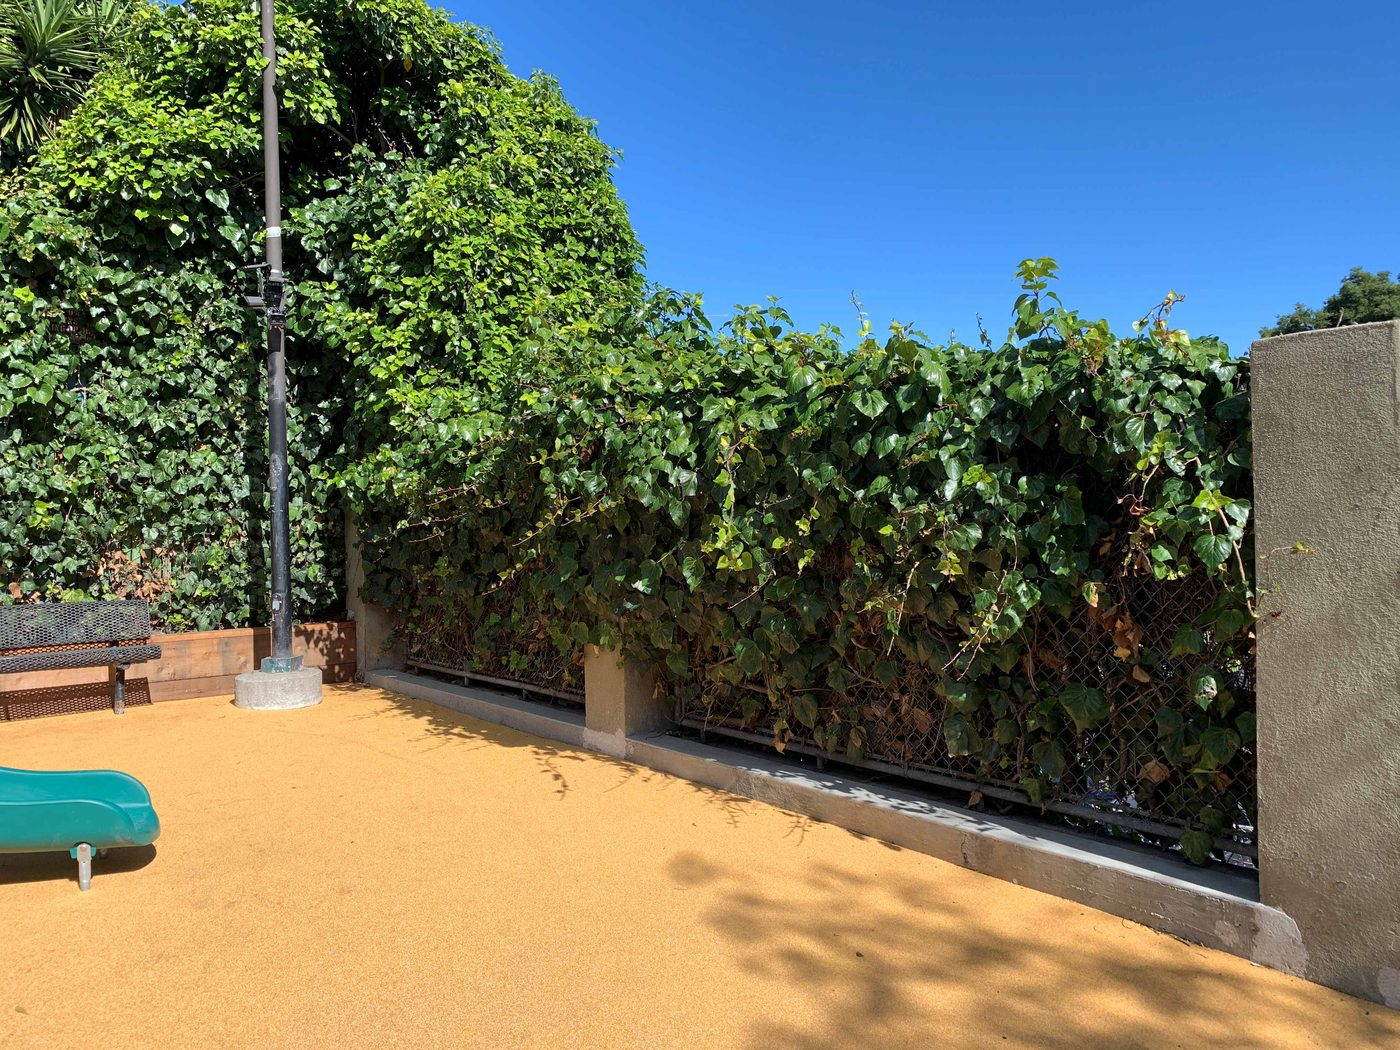
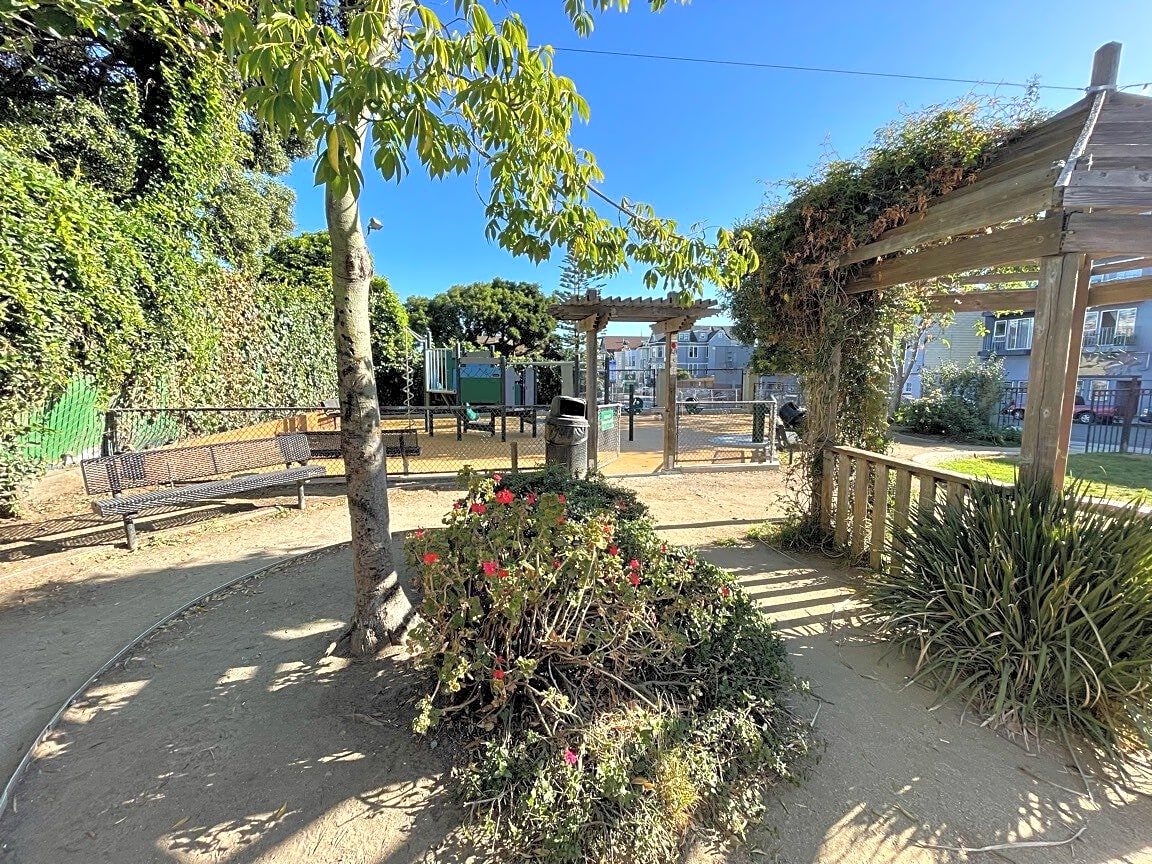
Alioto Mini Park today, after Rec & Park's management effort began.
After months of concerns about drug use, encampments, and other quality-of-life issues, Alioto Mini Park is once again becoming a welcoming space for children, families, and neighbors.
Since early June, San Francisco Recreation and Parks, working alongside partner City departments, has increased attention to the park through regular cleanups and clearings, increased Park Ranger patrols, and new security cameras. Rec and Park also made physical improvements, repaving the children’s play area and replacing play equipment and installing a new, more secure fence for the park’s community garden.
With improved conditions, children and seniors are returning to the park, and community gardeners held a well-attended open house. Continuing coordination with SFPD and Public Works is helping to return this neighborhood space to its intended purpose: a safe, welcoming place where families can play, gather, and enjoy their community.
- -78% Drug-related 911 calls since deployment
- -42% Homelessness-related concerns since deployment
SFPUC & Public Works
Brighter streets along Mission
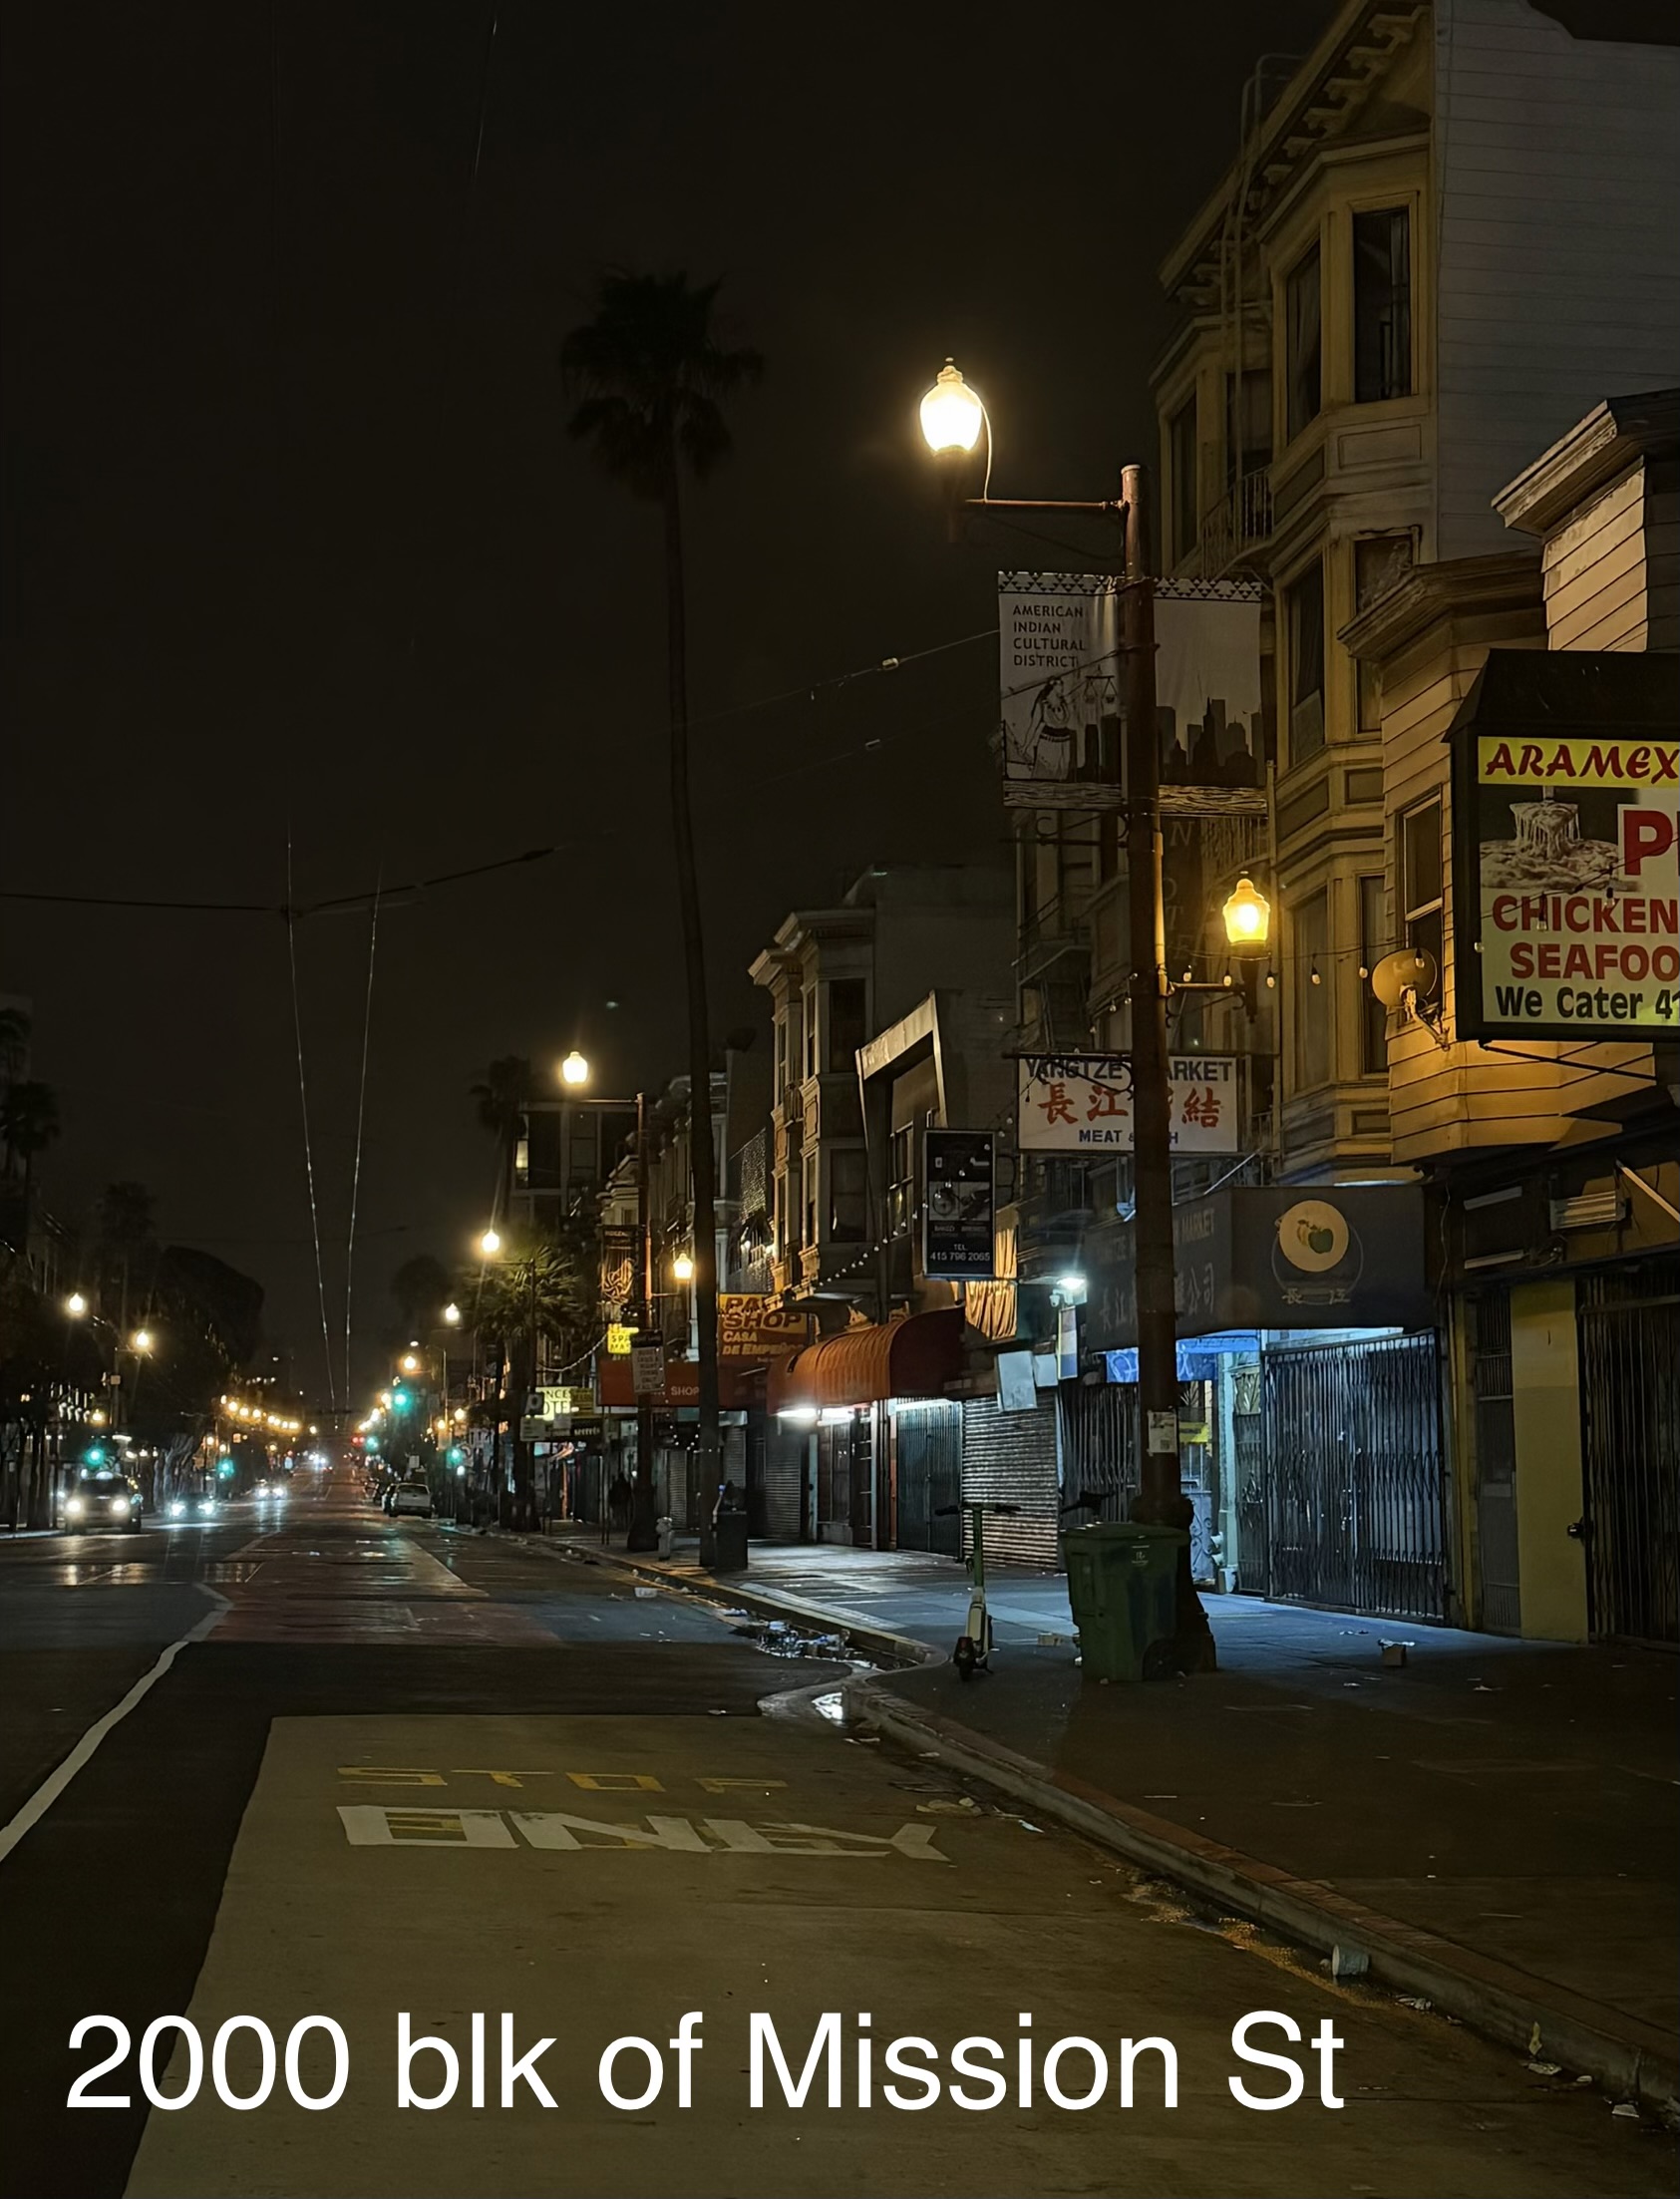
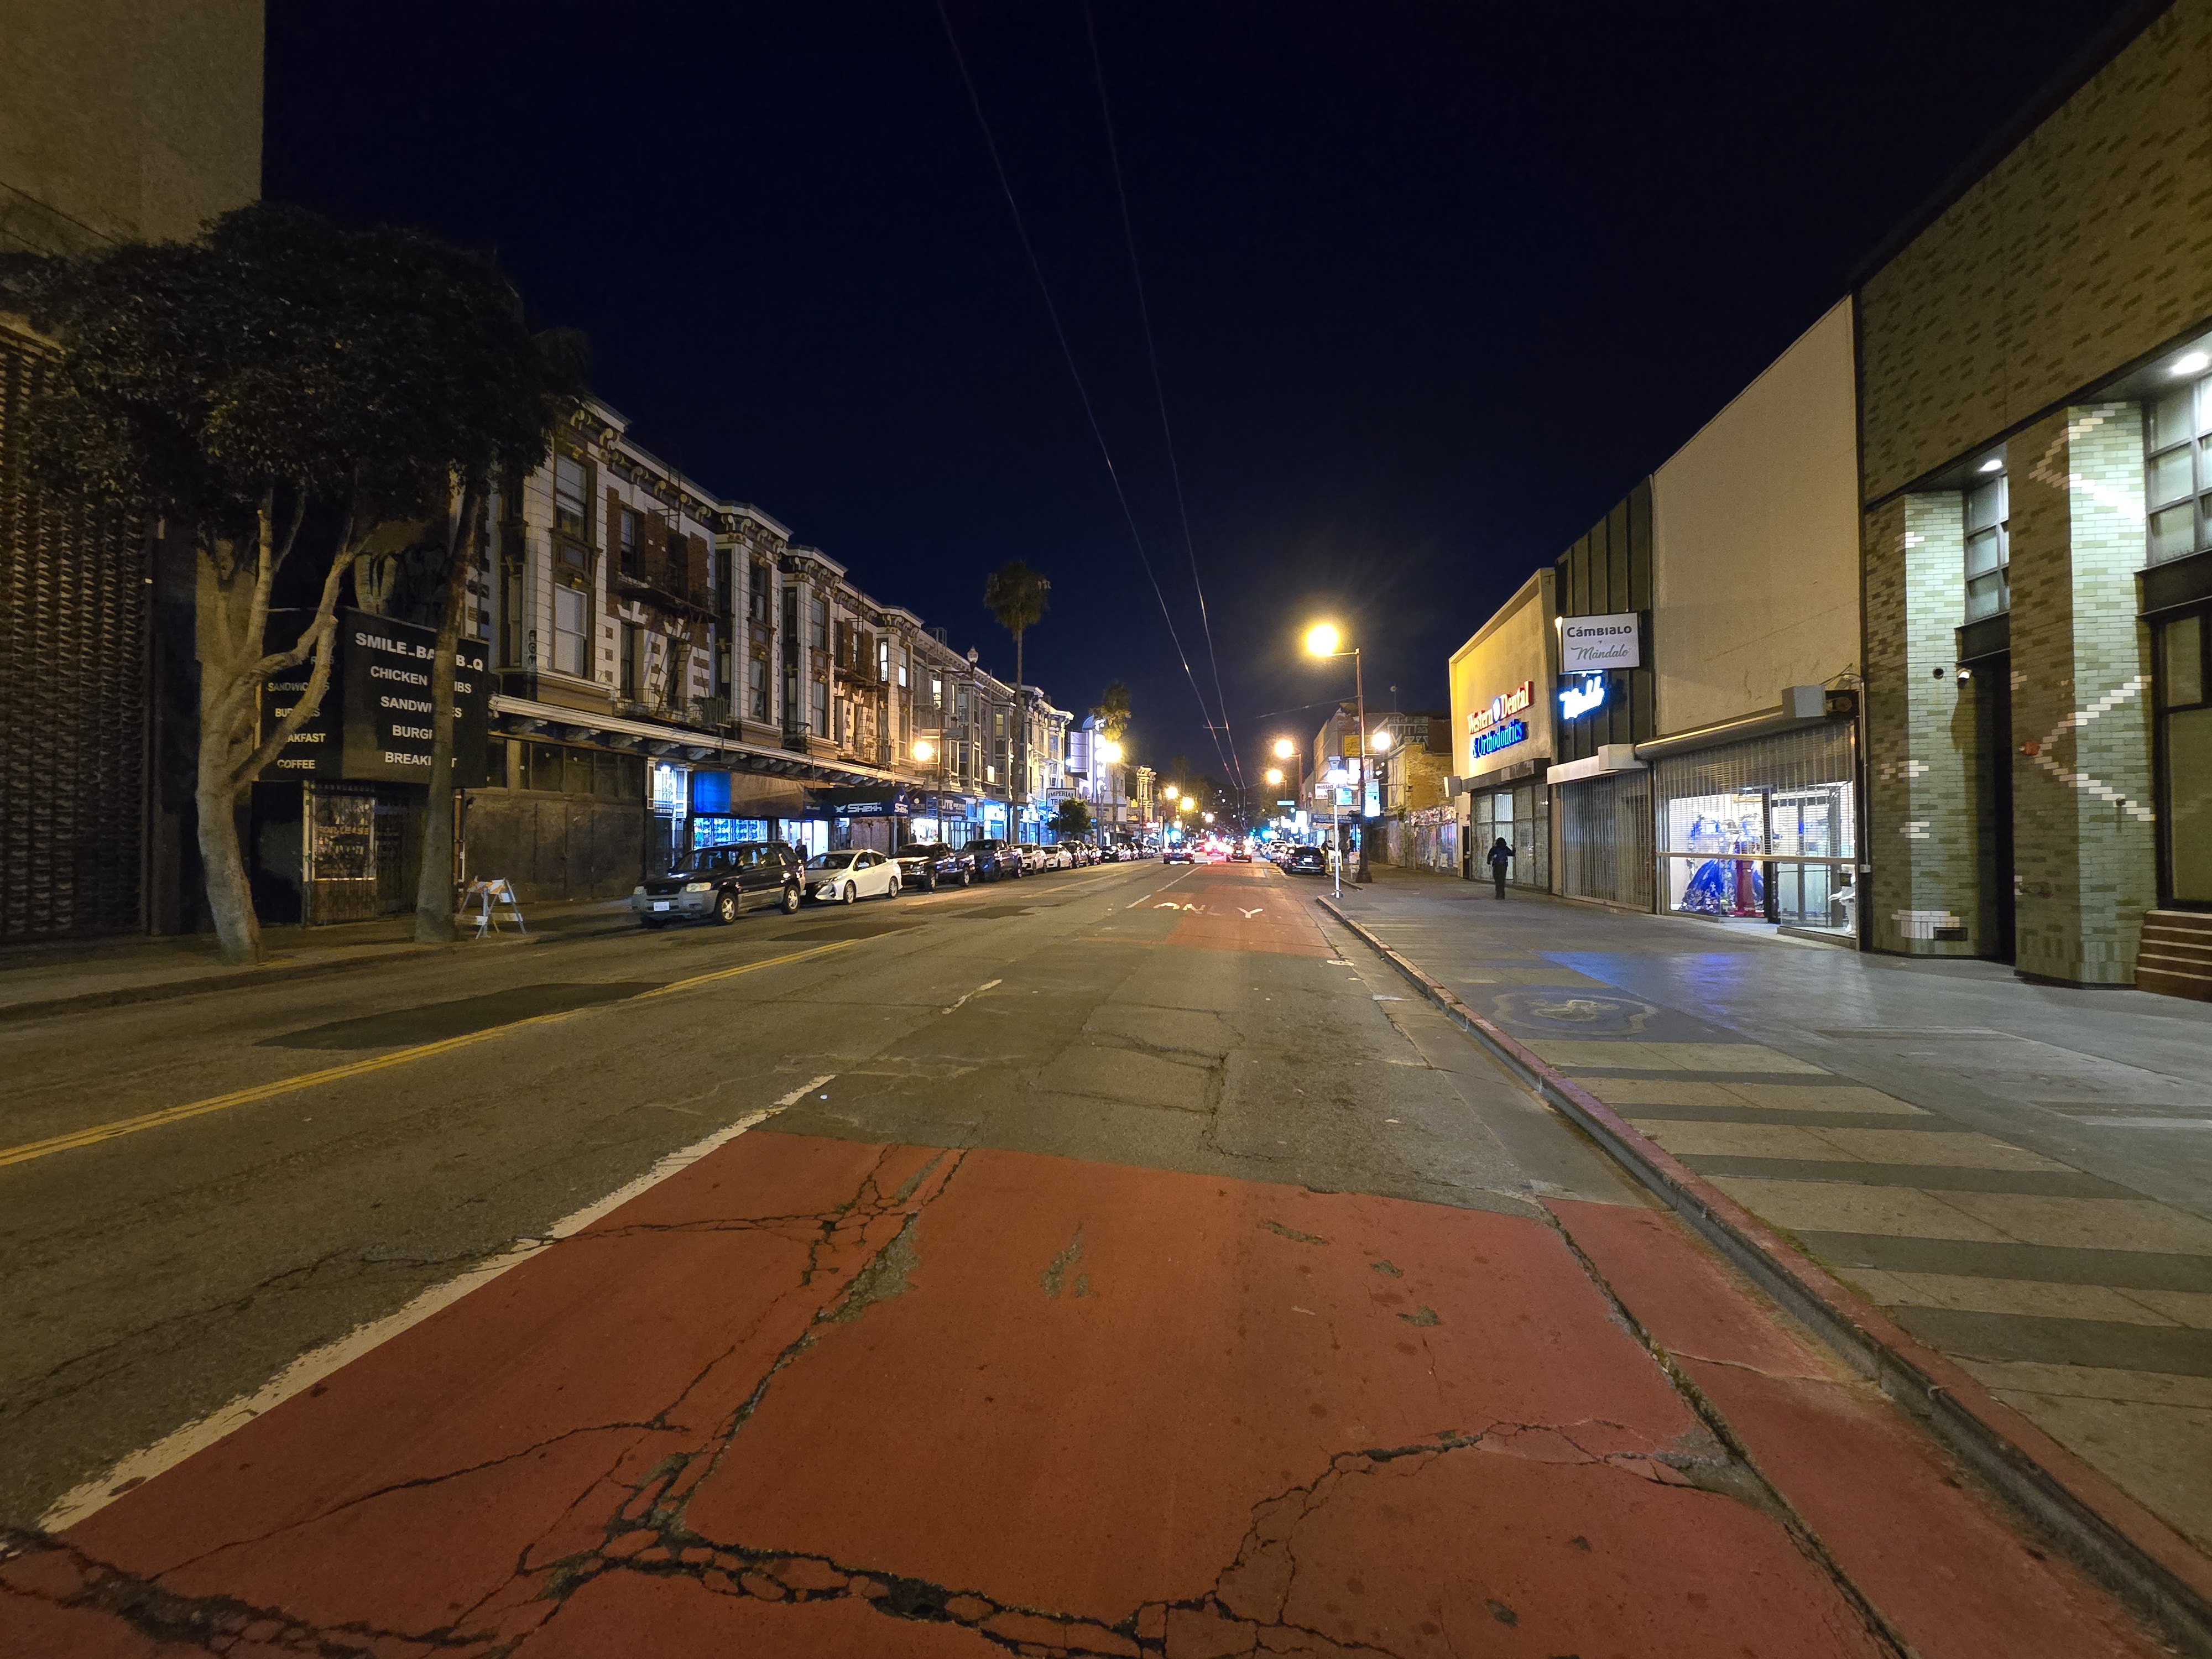
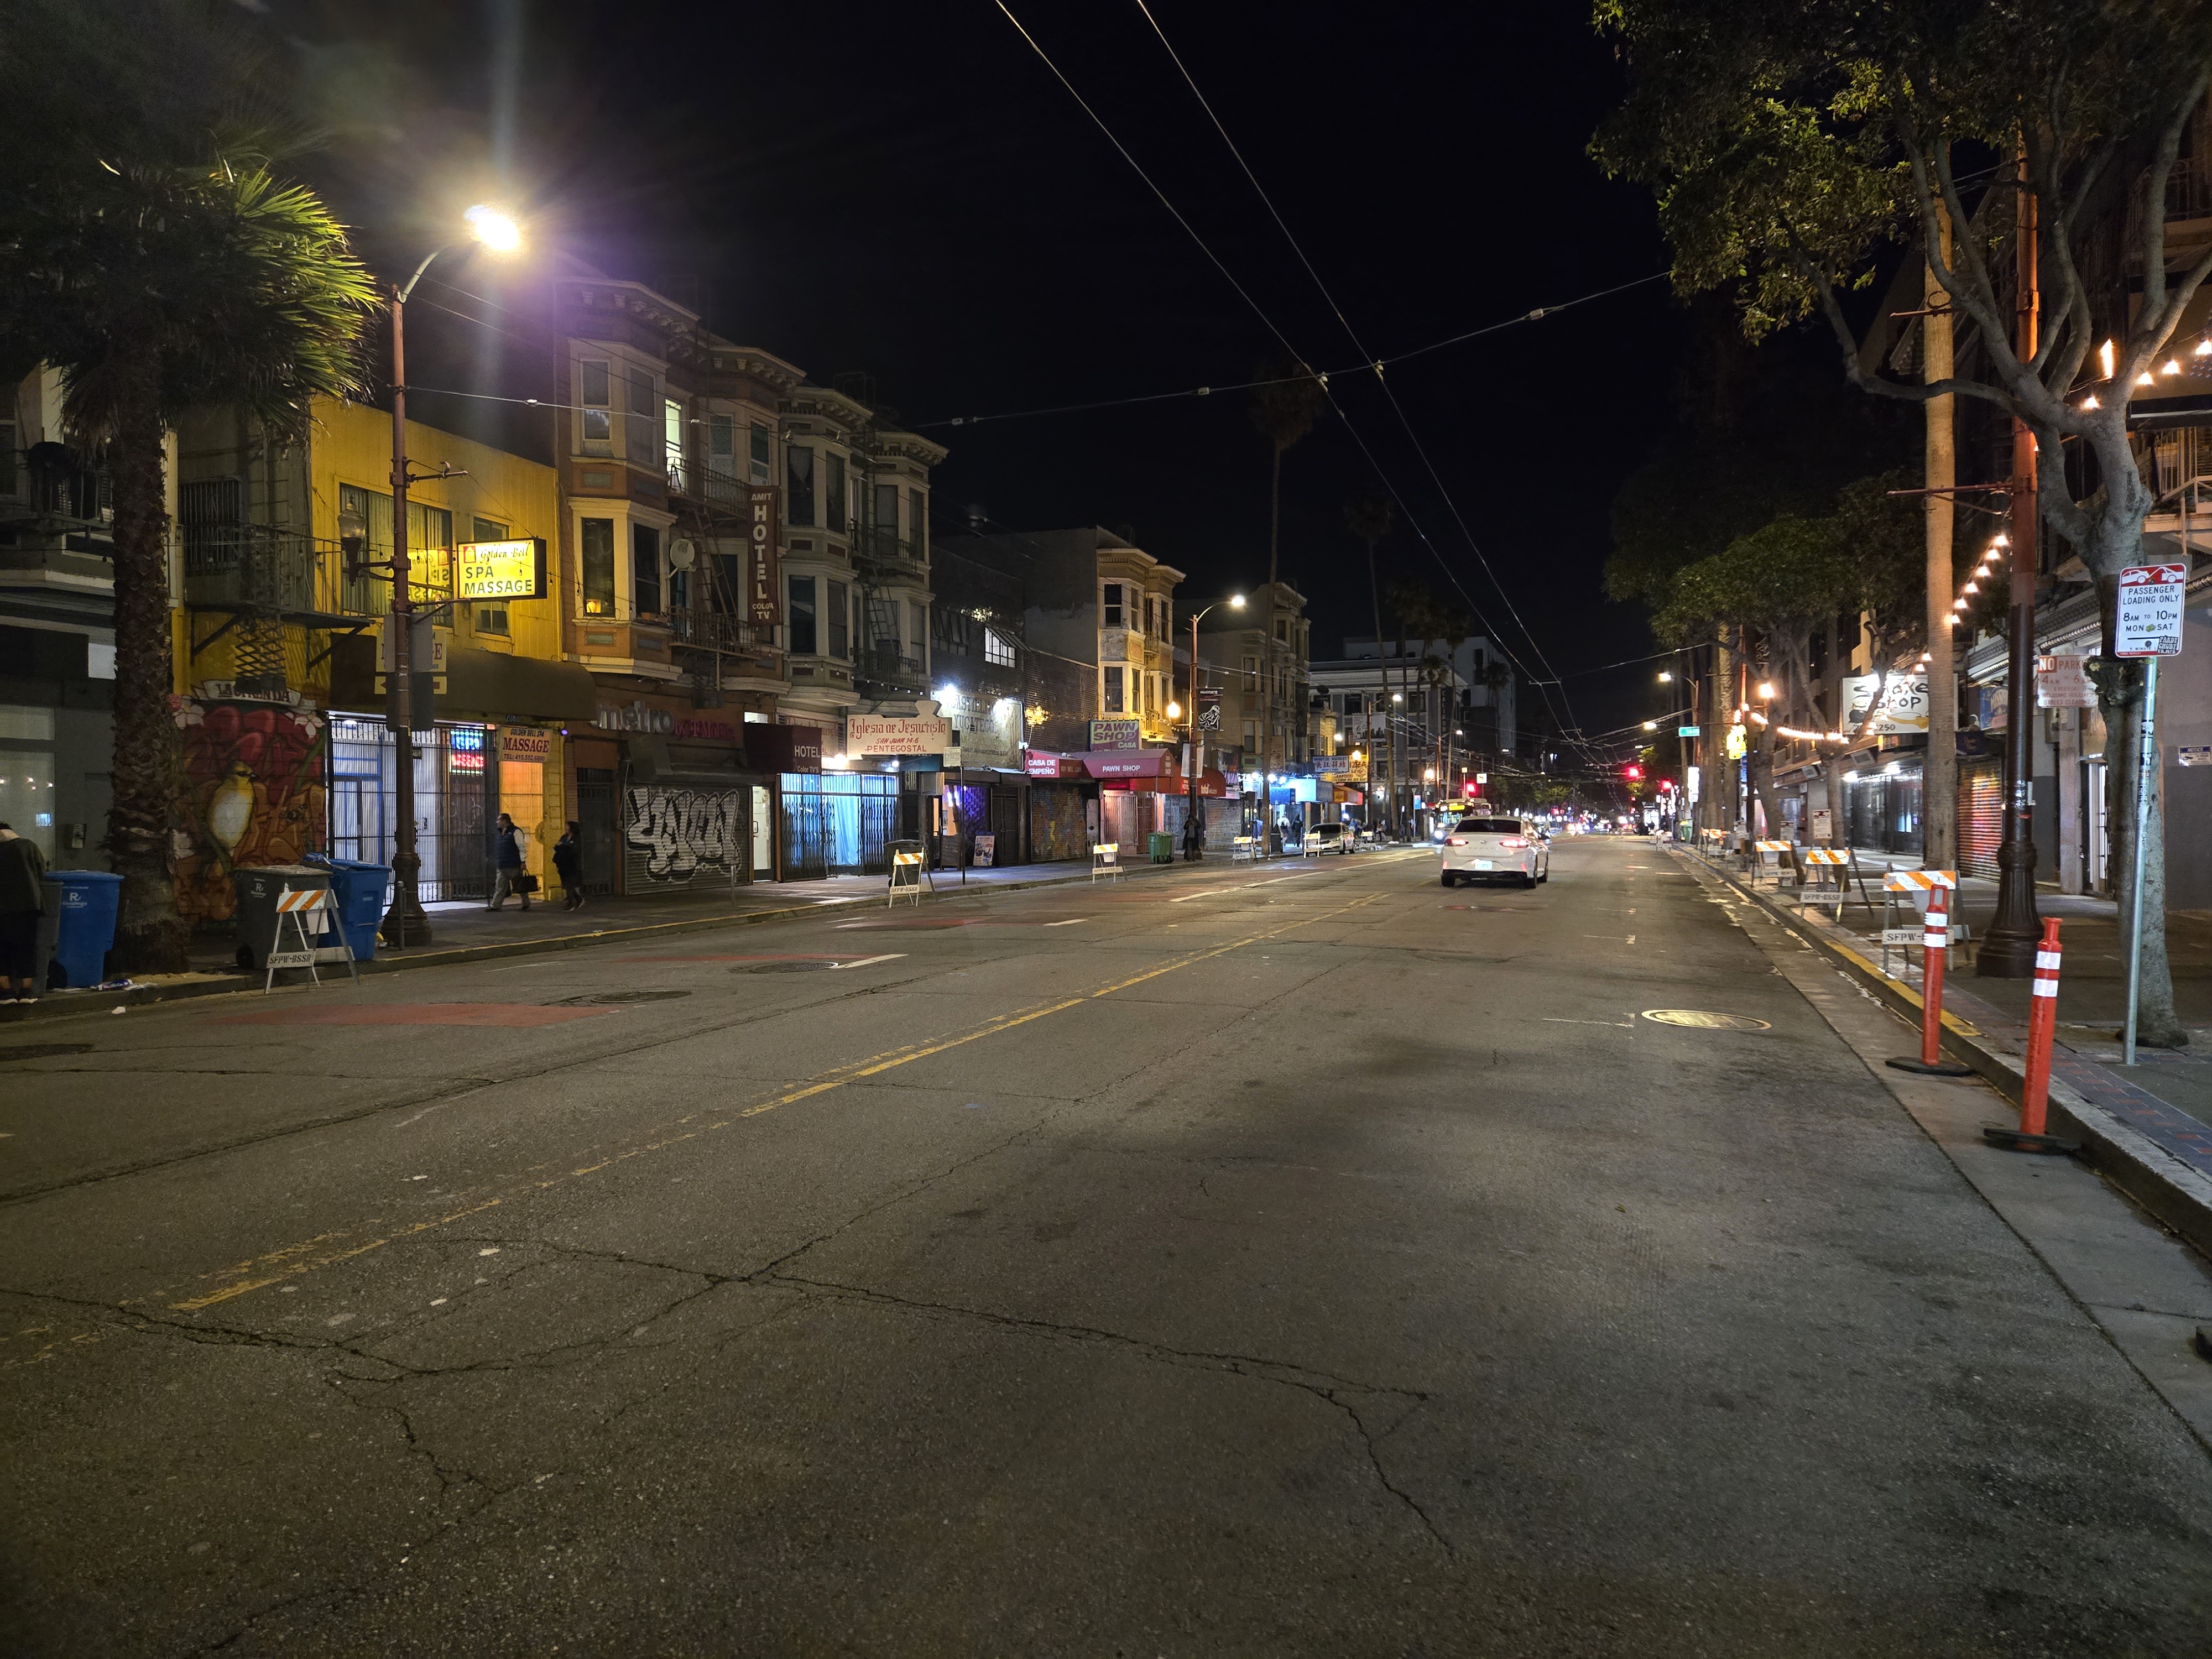
The City has made a series of lighting and visibility improvements along Mission Street between 15th and 17th streets to make the corridor brighter and more welcoming at night.
After identifying several burned-out streetlights during a nighttime assessment, SFPUC replaced the lights and conducted a broader assessment of lighting conditions along the two-block stretch. Based on that assessment, intersection lights at 15th, 16th, and 17th streets were upgraded with brighter bulbs, and decorative mid-block lights between 16th and 17th streets were replaced with cobra-head streetlights that provide stronger illumination.
Public Works' Urban Forestry team also trimmed trees along the corridor to reduce obstructions and help more light reach the sidewalk and street.
Together, these improvements are helping create a brighter, more visible environment for residents, businesses, and visitors traveling along Mission Street after dark.
Public Works
Proactive Cleanings
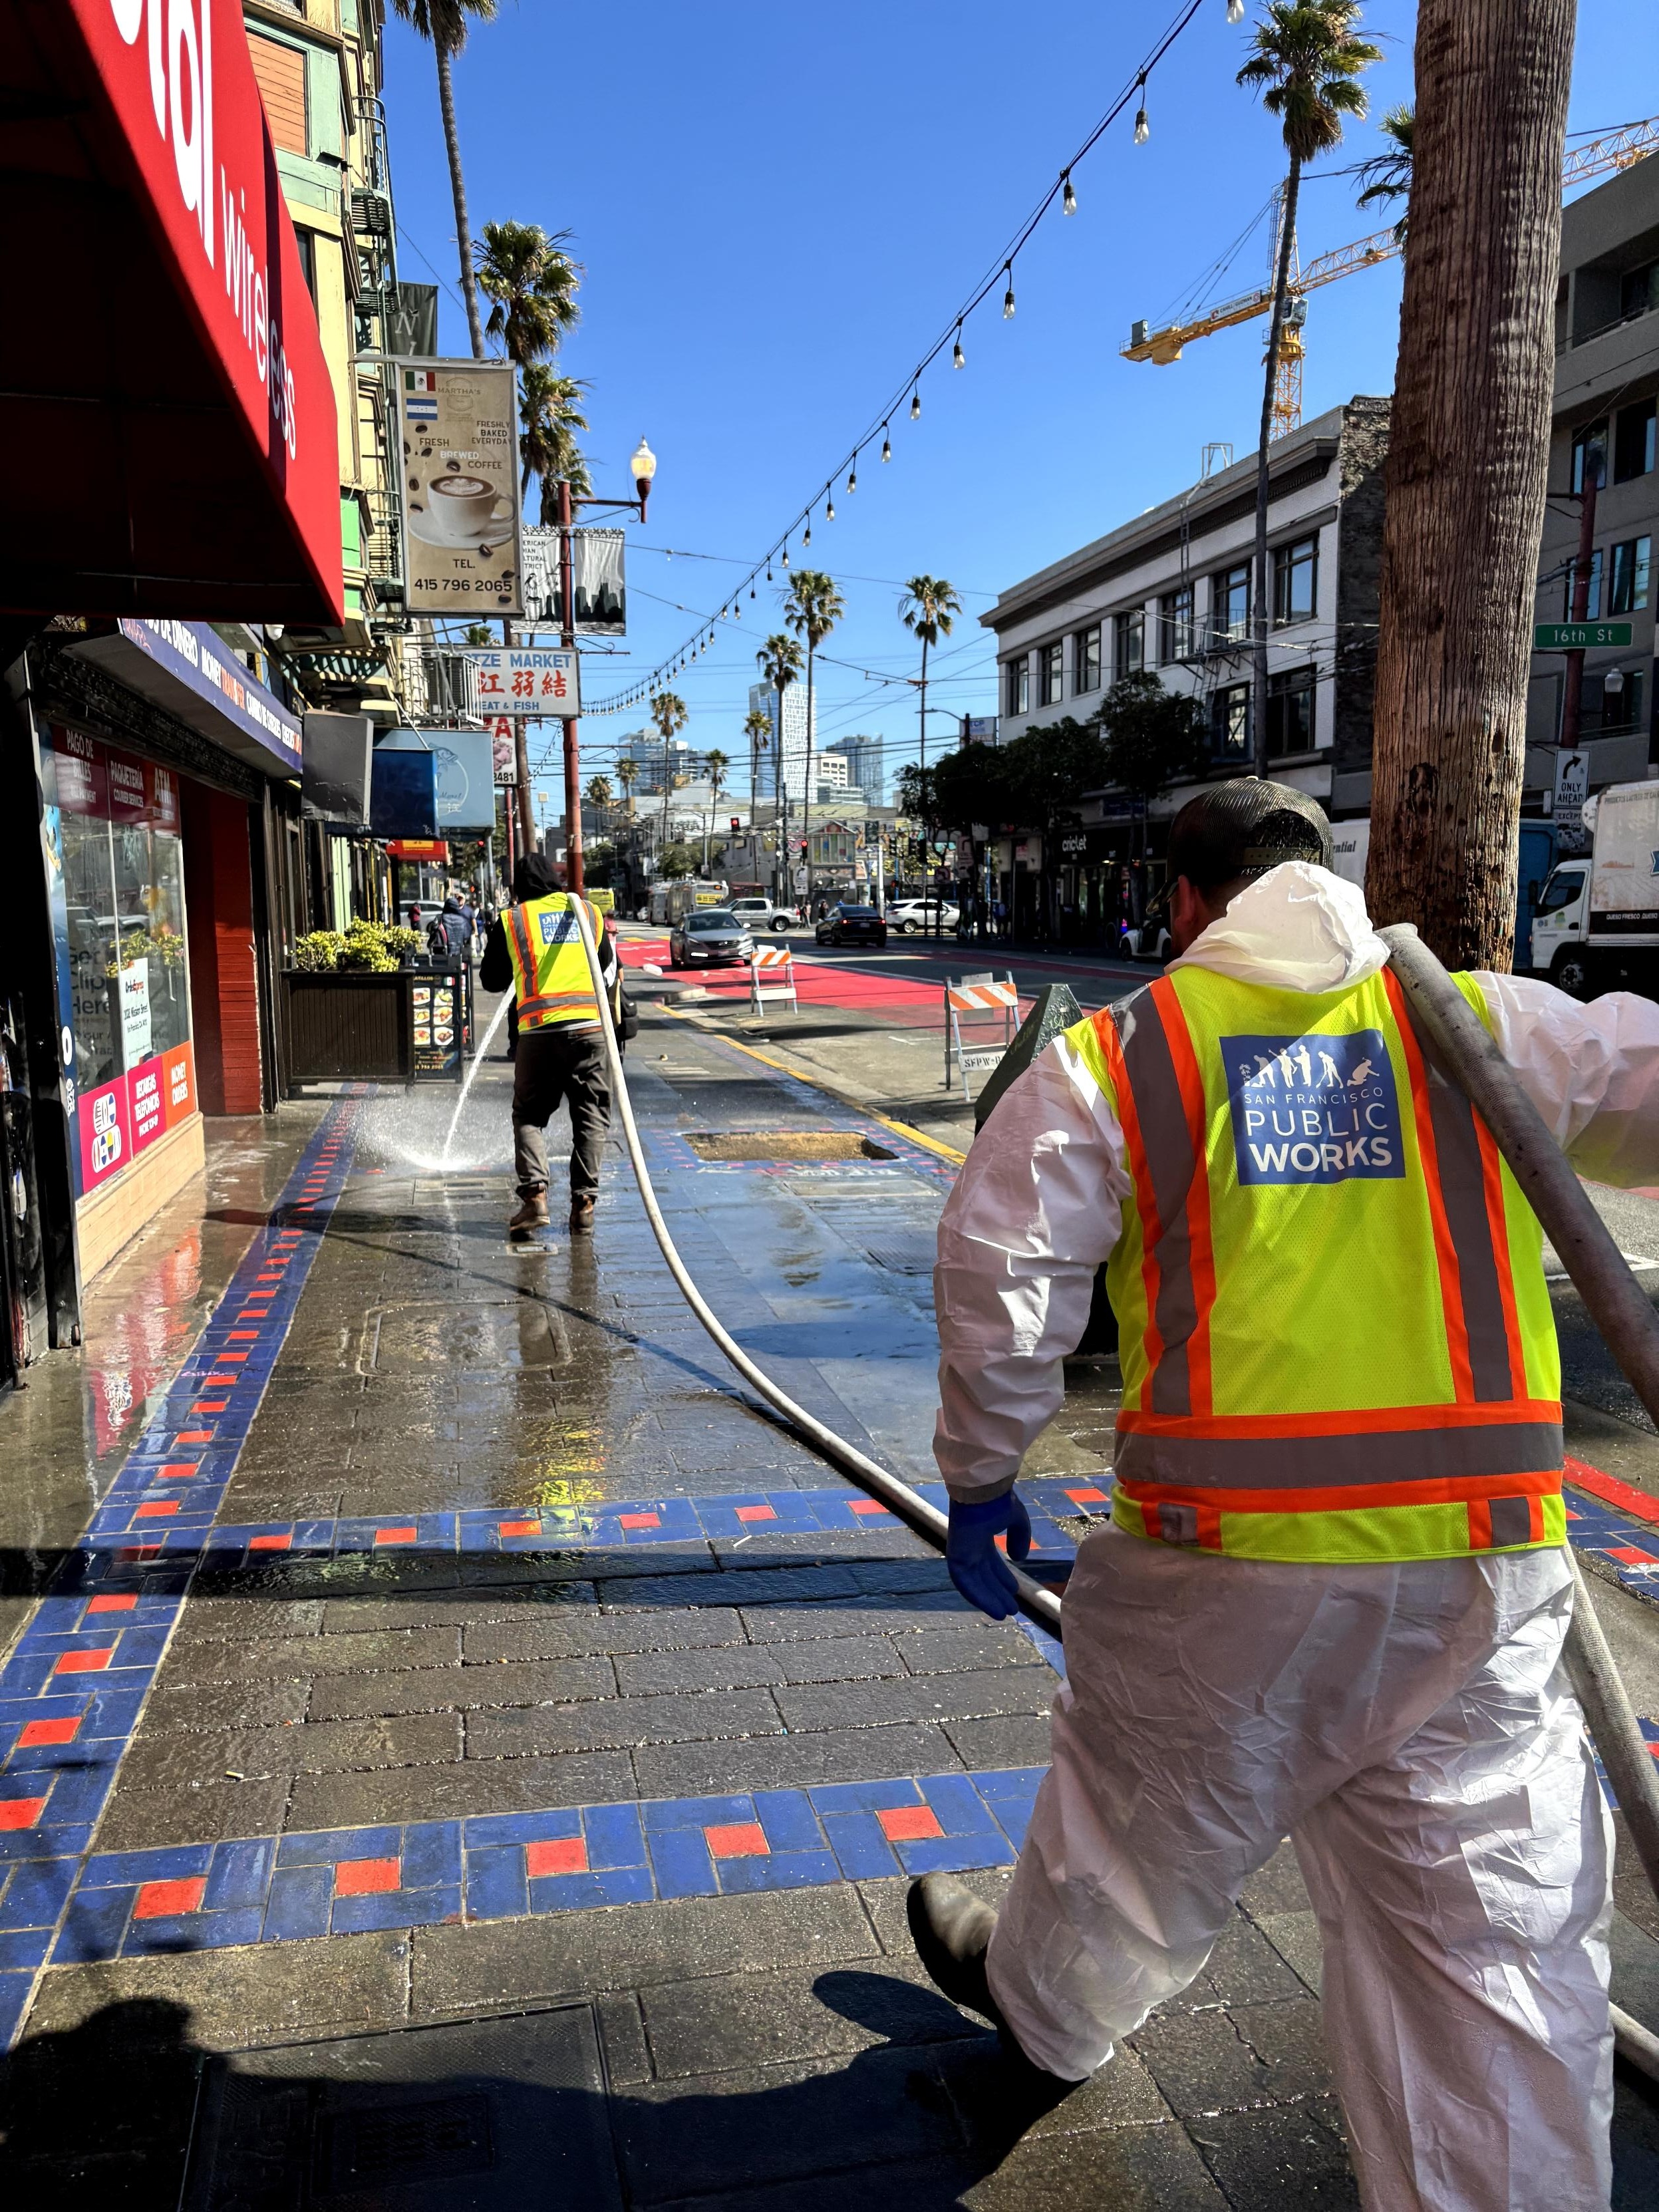
311 requests capture only a portion of the cleaning work happening across the Mission. In addition to responding to reported issues, Public Works provides a broad range of proactive and regularly scheduled services to keep streets, sidewalks, and public spaces clean.
This includes daily litter and sidewalk sweeping along commercial corridors; mechanical street and bike-lane sweeping; steam cleaning and graffiti abatement; maintenance of public trash cans; and recurring cleaning around BART plazas, schools, parks, and other high-use locations. Public Works also deploys specialized services, including high-pressure flusher trucks, deep-cleaning through CleanCorridorsSF, and coordinated Neighborhood Street Team operations.
Some locations receive particularly frequent attention. The 16th and 24th Street BART plazas are cleaned three times a day, while areas such as Marshall Elementary School and Alioto Mini Park receive regular targeted cleaning. Crews also use tools like temporary A-frames to create access for more thorough street cleaning, steaming, and graffiti removal.
Together, these services represent a significant amount of cleaning activity that happens without a resident first submitting a 311 request.
Department of Emergency Management
Community Ambassadors
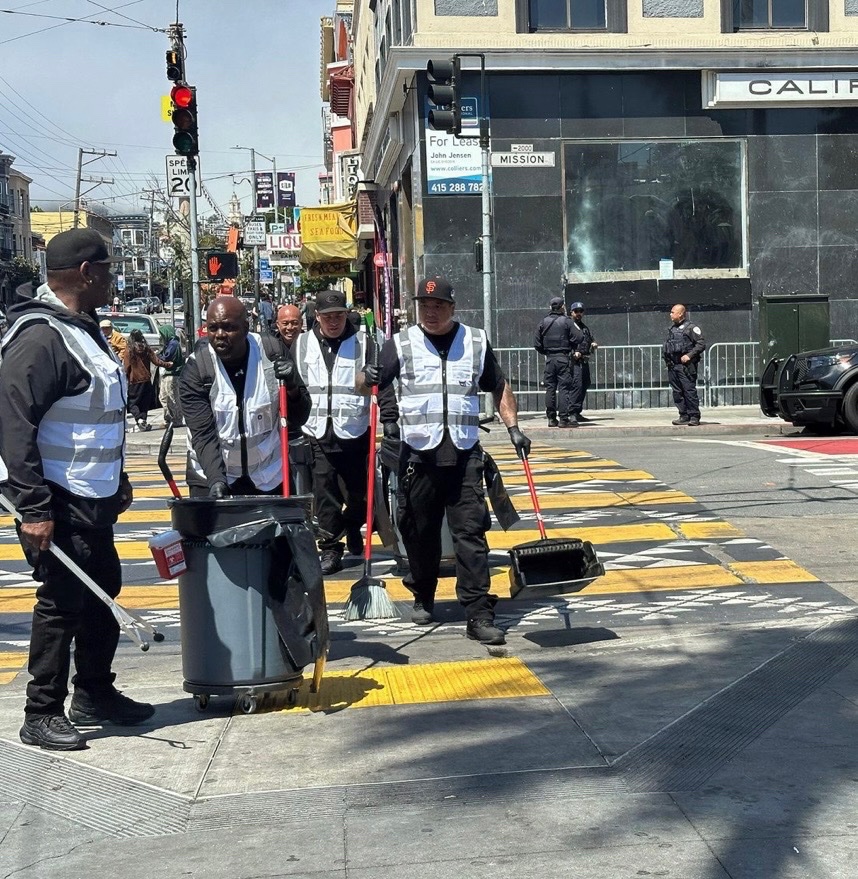
Community Ambassadors overseen by San Francisco's Department of Emergency Management (DEM) provide a visible, welcoming presence on city streets, helping residents, visitors, and businesses navigate everyday challenges in busy public spaces.
Ambassadors engage directly with people on the street, provide information and assistance, help connect people in need with City services, and flag conditions that require a response from other departments. By serving as an approachable set of eyes and ears on the ground, ambassadors help address issues earlier, connect people to the right resources, and contribute to cleaner, safer, and more welcoming streets.
- 97,775 street engagements (Jan–Jun)
- 1,538 de-escalations
- 15 overdose reversals
- 1,390 needles collected
DEM Community Ambassadors program data, January–June 2026.
Department of Public Health
Street Teams
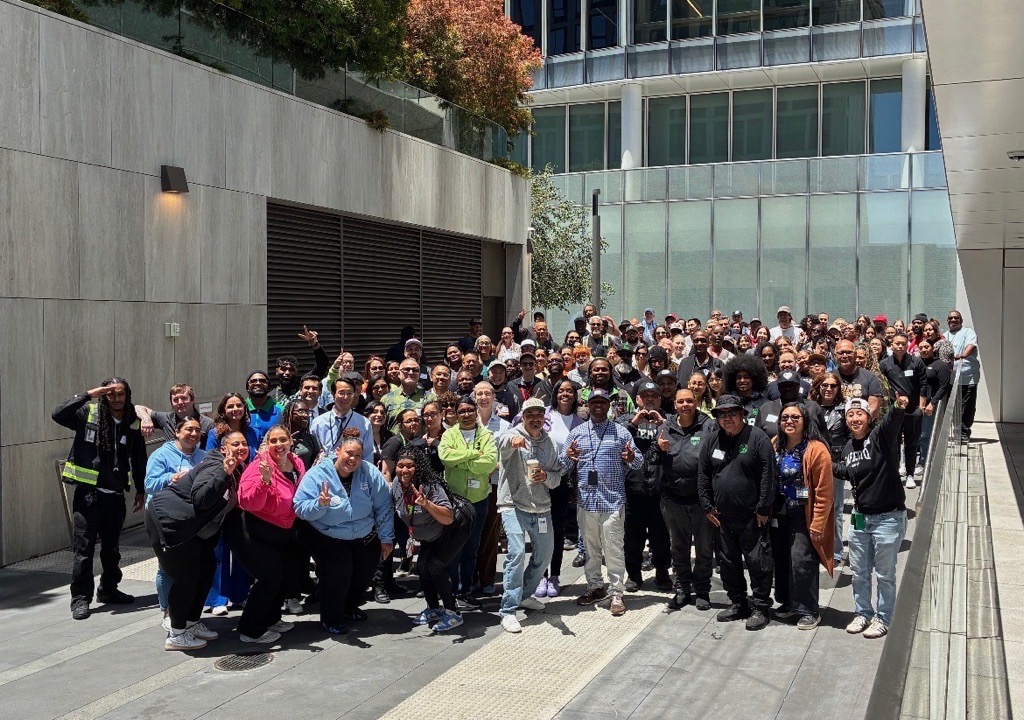
When someone calls 311 about a person in crisis on the street, the City sends trained outreach workers to build relationships and connect people to care.
The Department of Public Health operates two specialized street teams. The Rapid Response Team (RRT) responds quickly to 311 calls and street encounters, meeting people where they are and offering immediate help like shelter placement or medical attention. The Shared Priority Team (SPT) focuses on the highest-risk individuals, providing ongoing clinical care for people with complex behavioral health and medical needs. The 16th Street BART corridor generates the most service calls in the Mission, and in the past two months the Mission/Castro team logged the highest engagement of any neighborhood in the city.
One client, one team: A younger woman in her thirties living with a substance use disorder had been receiving care in pieces for months. A hospital stay here, a shelter bed there, no one holding the thread between them. Once the Shared Priority Team met her on an inpatient unit, the same team stayed with her across every setting she moved through. A counselor found her outside after she lost her shelter bed and worked with her on a plan for that night. A nurse reviewed her medications with her on the street. The team called ahead to a shelter clinic, secured a bed, and put her on the phone with staff so she heard the expectations in her own words. When she was anxious and alone the next week, the team was there within the day, and again the morning after that. Nine days after that first hospital visit, she was resting in a residential program with on-site support. It was what she had asked for from the beginning: a place where she would not have to manage her medications alone. One client. One team. Six visits, and a door that finally opened.
- 94 311 tickets (Jul 1 - Aug 23)
- 100% tickets closed
- 1,542 outreach contacts
OEWD
Sábado Gigante
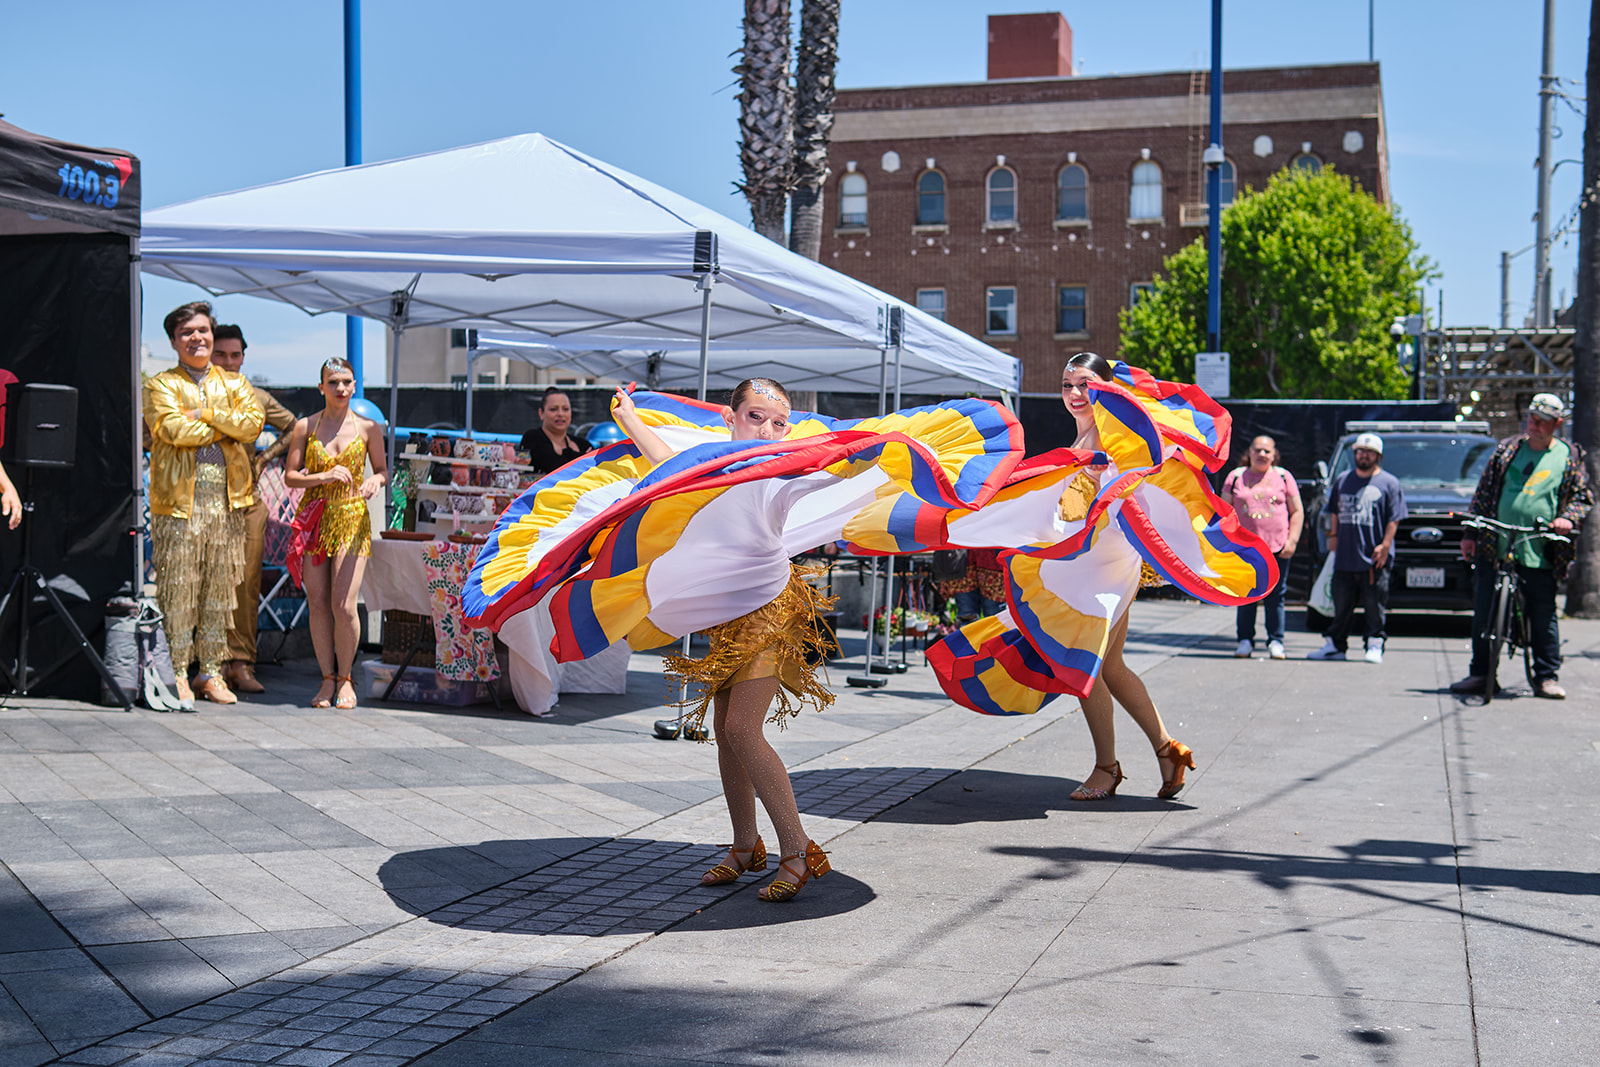
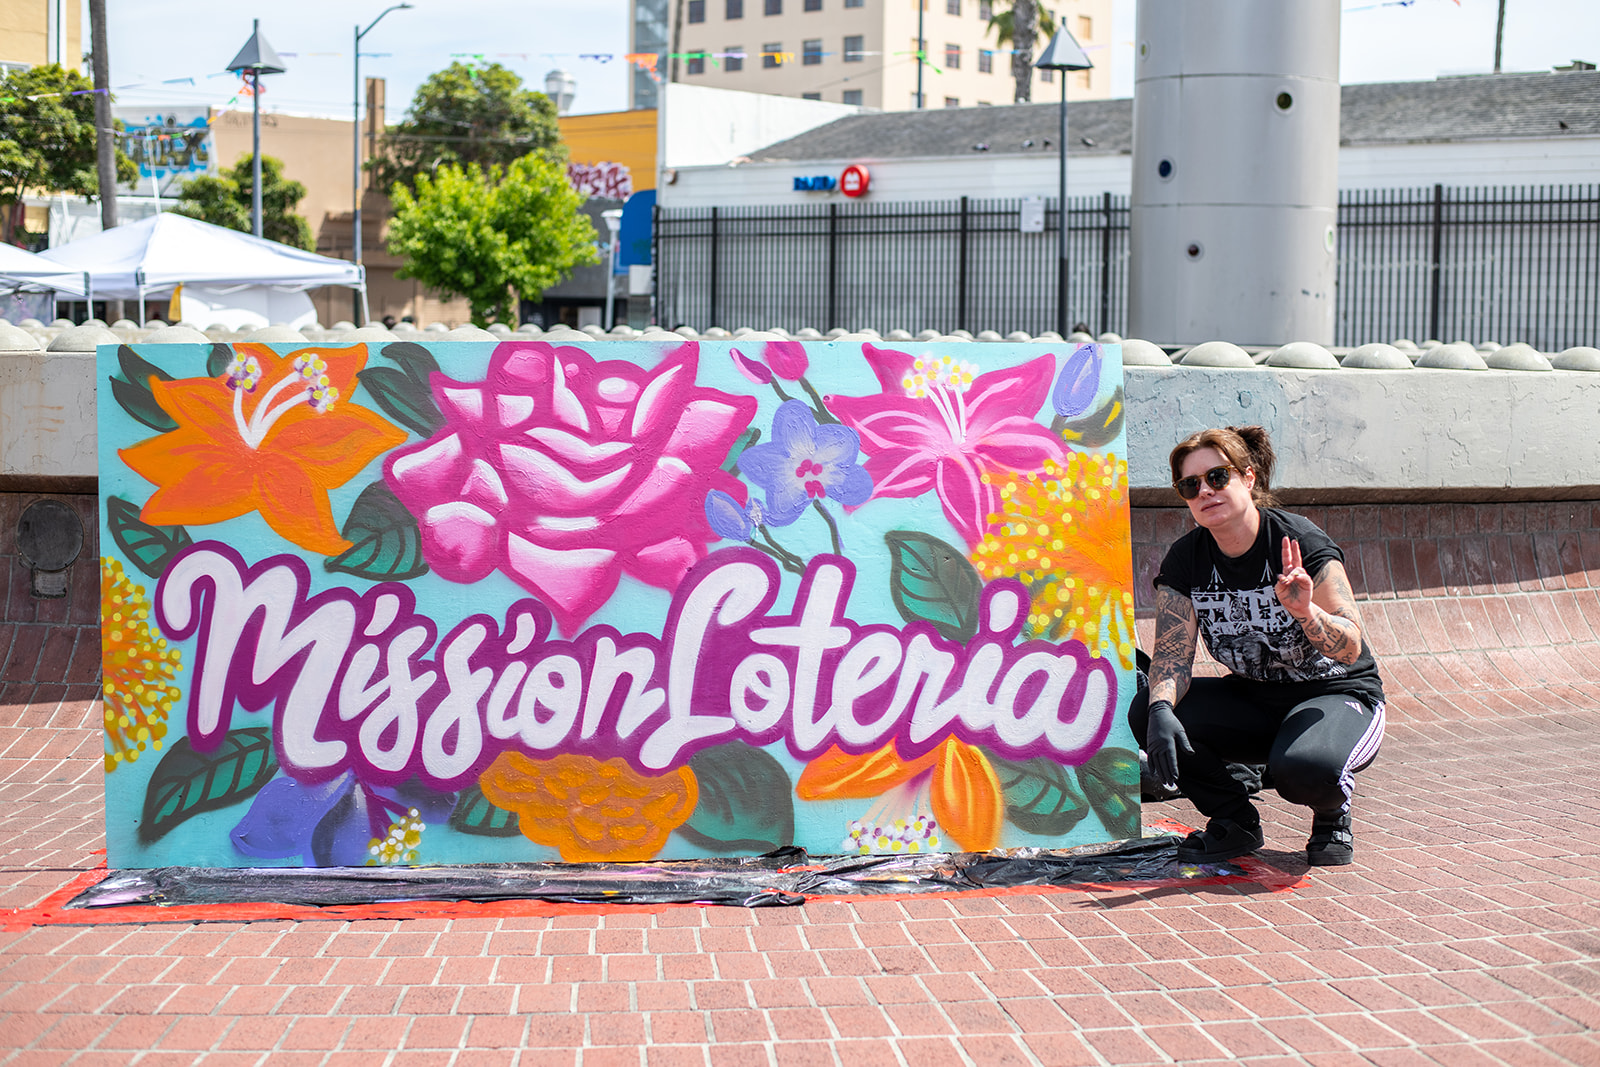
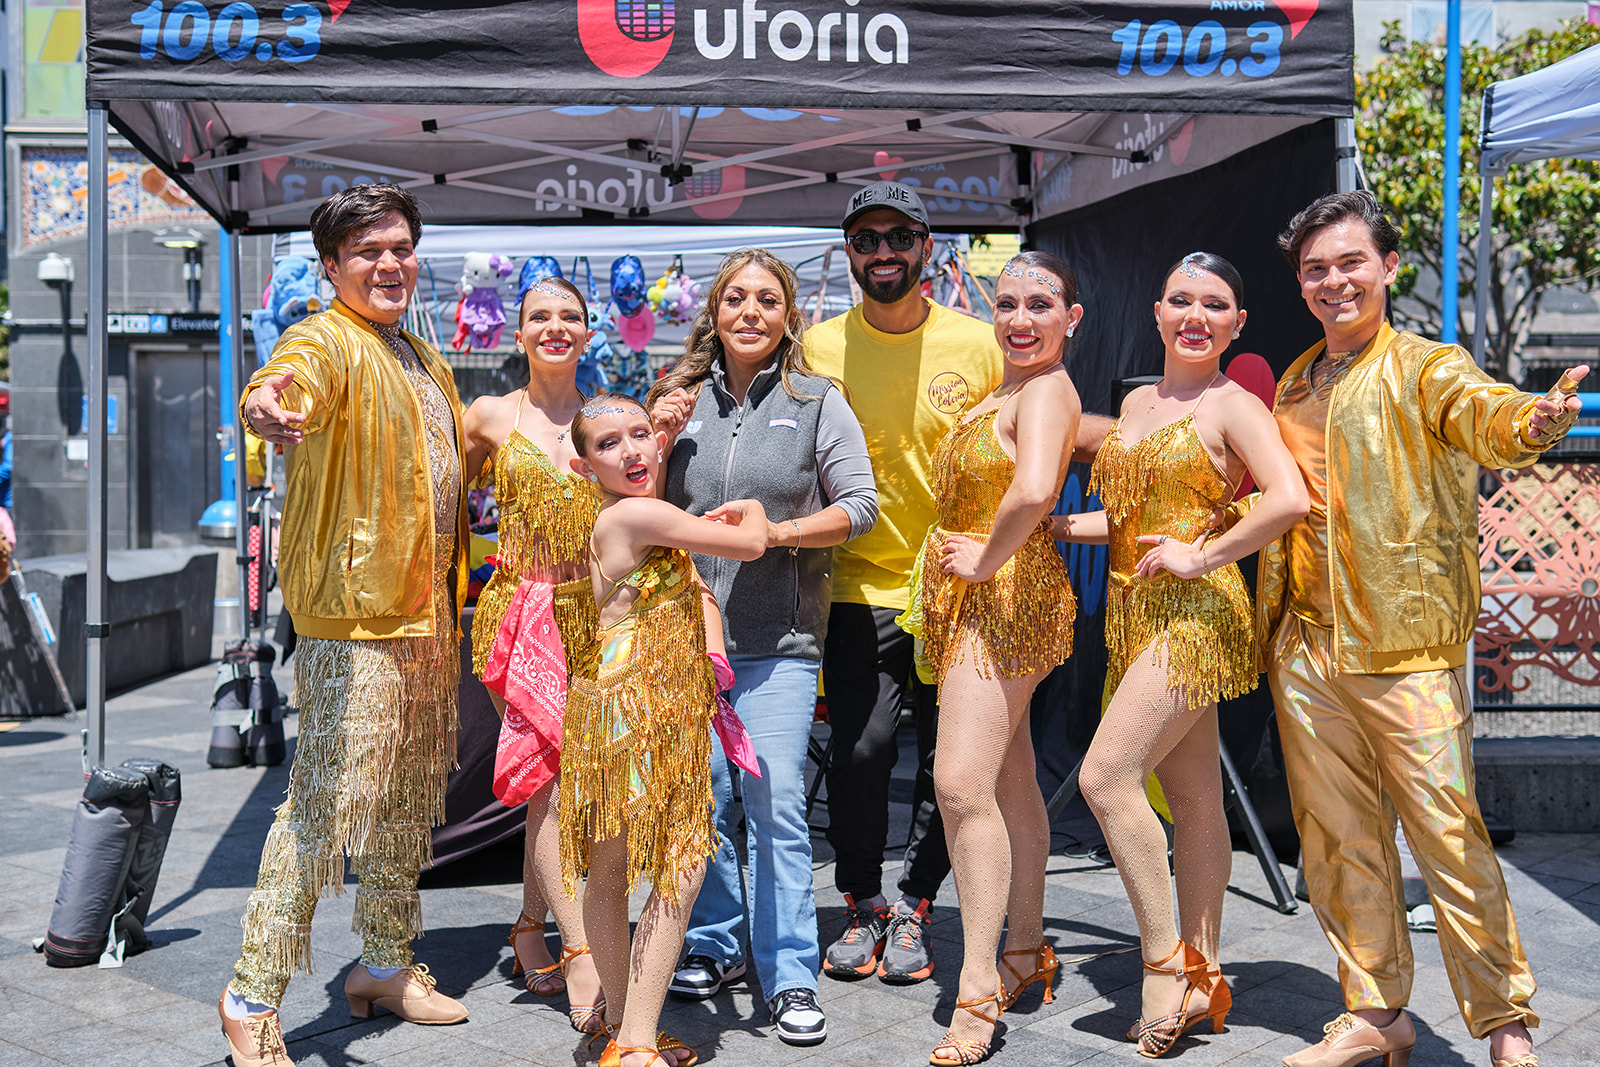
Sábado Gigante is a recurring community activation series that transforms the 16th and 24th Street BART Plazas into welcoming spaces for small businesses, artists, families, residents, and visitors.
The series was created to bring positive, consistent programming to two of the Mission District's most visible public spaces while creating economic opportunities for neighborhood entrepreneurs and street vendors. Each activation brings together local vendors, community organizations, artists, cultural programming, games, family-friendly activities, and community resources.
The recurring nature of Sábado Gigante has been especially important. Rather than approaching the plazas through one-time events, Mission Lotería has established an ongoing presence that gives residents, vendors, volunteers, and community partners something they can return to throughout the year.
- 6 activations (Jun–Aug)
- 1,200 total attendance
Mission Lotería activation data, June–August 2026.
About the data
“Key result” charts track this effort's official KPIs (Key Performance Indicators). Several outcomes are sourced directly from the City's public open data portal, DataSF (linked above). All other figures are reported across the coordinating city departments and BART, and are updated monthly.
Geographic scope
DataSF metrics (911 calls, incident reports, 311 tickets) are filtered to a 100-meter radius around each BART plaza entrance. This covers roughly 15th to 17th Street and Capp Street to Julian Avenue, capturing the immediate plaza area without extending to South Van Ness.
Center points: 16th St BART (37.7650, -122.4194) and 24th St BART (37.7524, -122.4183).
How this dashboard is updated
This page is regenerated once a month from a single data file and republished as a static page. Charts are plain SVG with no JavaScript, so they render even with scripts disabled; every chart is followed by the same numbers in a plain data table. This page does not use cookies, trackers, or client-side data collection.